Why Your Shopify ROAS is Lying: The 2026 Guide to Marketing Efficiency Ratio (MER)
Is your Shopify ROAS a lie? Learn why Marketing Efficiency Ratio (MER) is the only metric that matters in 2026 and how to optimize your ad spend for real profit.
It is 2026, and if you are still relying on the return on ad spend (ROAS) figures inside your Meta Ads Manager or Google Ads dashboard to run your business, you are likely burning through your profit margins. We have all been there: the dashboard shows a healthy 4.5x ROAS, your creative team is celebrating, yet the actual cash in your business bank account is dwindling. This discrepancy isn't a glitch; it is the fundamental reality of a multi-channel Shopify environment where every platform is fighting to claim the same sale.
To survive and scale this year, Shopify founders must transition from channel-specific metrics to the Marketing Efficiency Ratio (MER). MER is the holistic view of how your total marketing investment translates into total revenue. It doesn't care which platform 'won' the click; it only cares if your business is actually growing. In this guide, we will break down why ROAS is lying to you, how to calculate your true Shopify marketing efficiency ratio, and how an AI ecommerce employee can automate this entire process so you never have to touch a manual spreadsheet again.
The Fundamental Flaw of Platform-Specific ROAS
Explore why relying solely on traditional ROAS might be misleading for Shopify store owners.
The primary issue with ROAS in 2026 is over-attribution and data duplication. When you run ads across TikTok Ads Manager, Meta, and Google, each platform uses its own proprietary tracking logic. If a customer sees a video on TikTok, clicks an Instagram ad the next day, and finally converts via a branded search on Google, all three platforms will likely claim 100% credit for that sale. Your dashboards will show three sales, but your Shopify admin only shows one.
Furthermore, platforms are increasingly relying on modeled conversions to fill the gaps left by privacy regulations and browser limitations. While these models are helpful for algorithm optimization, they are often too optimistic for financial planning. They represent a platform's best guess at performance, not your actual bank deposits. This is why MER vs ROAS 2026 is the most important debate in ecommerce today.
"ROAS doesn't show your full marketing performance. It only shows what one platform wants you to see, often including duplicated or phantom conversions that don't exist in your bank account."
Defining MER: The 'Blended ROAS' for 2026
Learn what MER is and why it provides a better ratio for marketing success.Marketing Efficiency Ratio (MER), also known as Blended ROAS, is a top-down metric that measures the efficiency of your total marketing spend against your total revenue. Unlike ROAS, which is siloed, MER provides a high-level view of your entire ecosystem. It removes the noise of attribution windows and focuses on the only thing that matters: How many dollars of revenue are generated for every dollar spent on marketing?
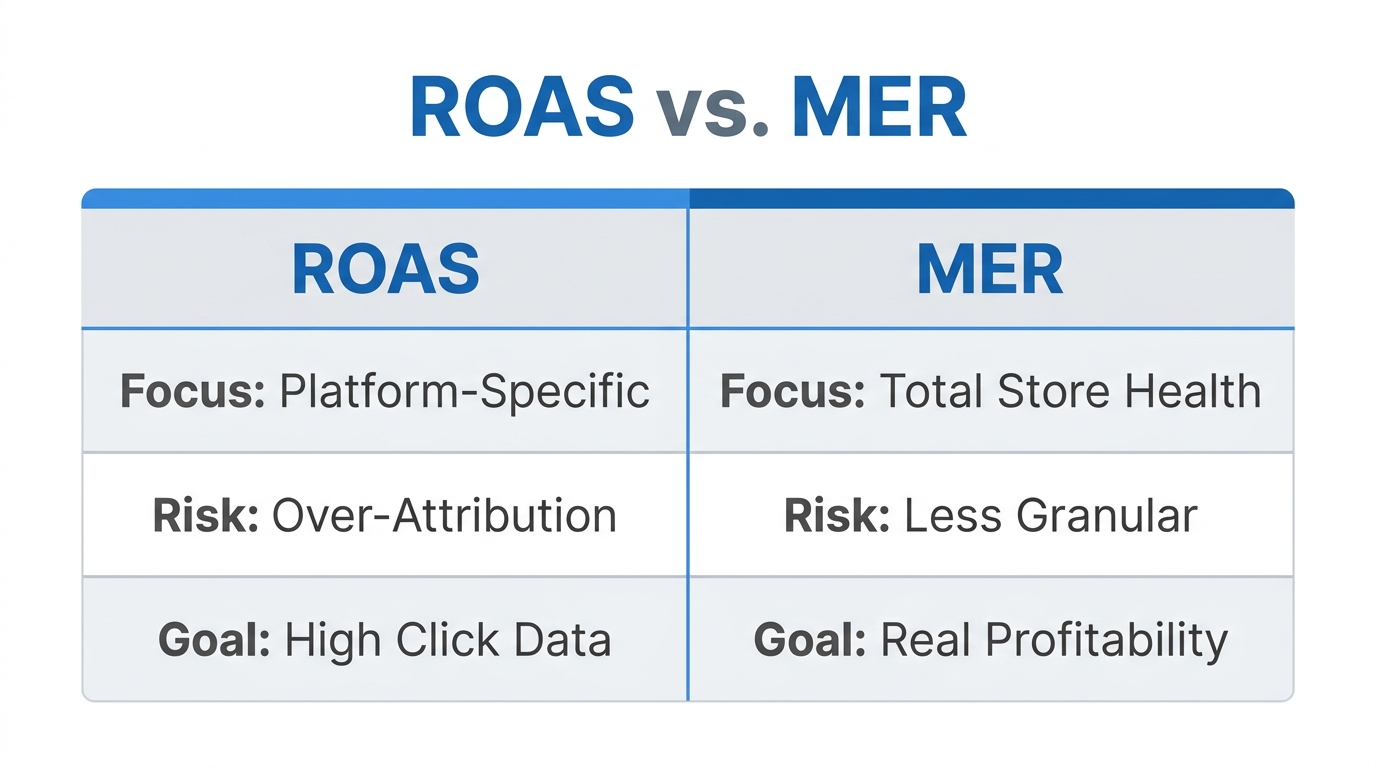
| Metric | Scope | Data Source | Primary Use |
|---|---|---|---|
| ROAS | Platform-specific (e.g., Meta only) | Ad Manager Pixels | Campaign-level optimization |
| MER | Total Business | Shopify Revenue + All Spend | Profitability & Scaling decisions |
By looking at MER, you stop worrying about which individual ad got the final click and start focusing on whether your combined marketing efforts are driving profitable growth. This is especially critical when running top-of-funnel awareness campaigns on TikTok that might not show a direct ROAS but significantly boost your Shopify profit analytics by driving organic and direct traffic.
The MER Formula: Step-by-Step Breakdown
Understand how to calculate your total marketing spend against all revenue sources for efficiency.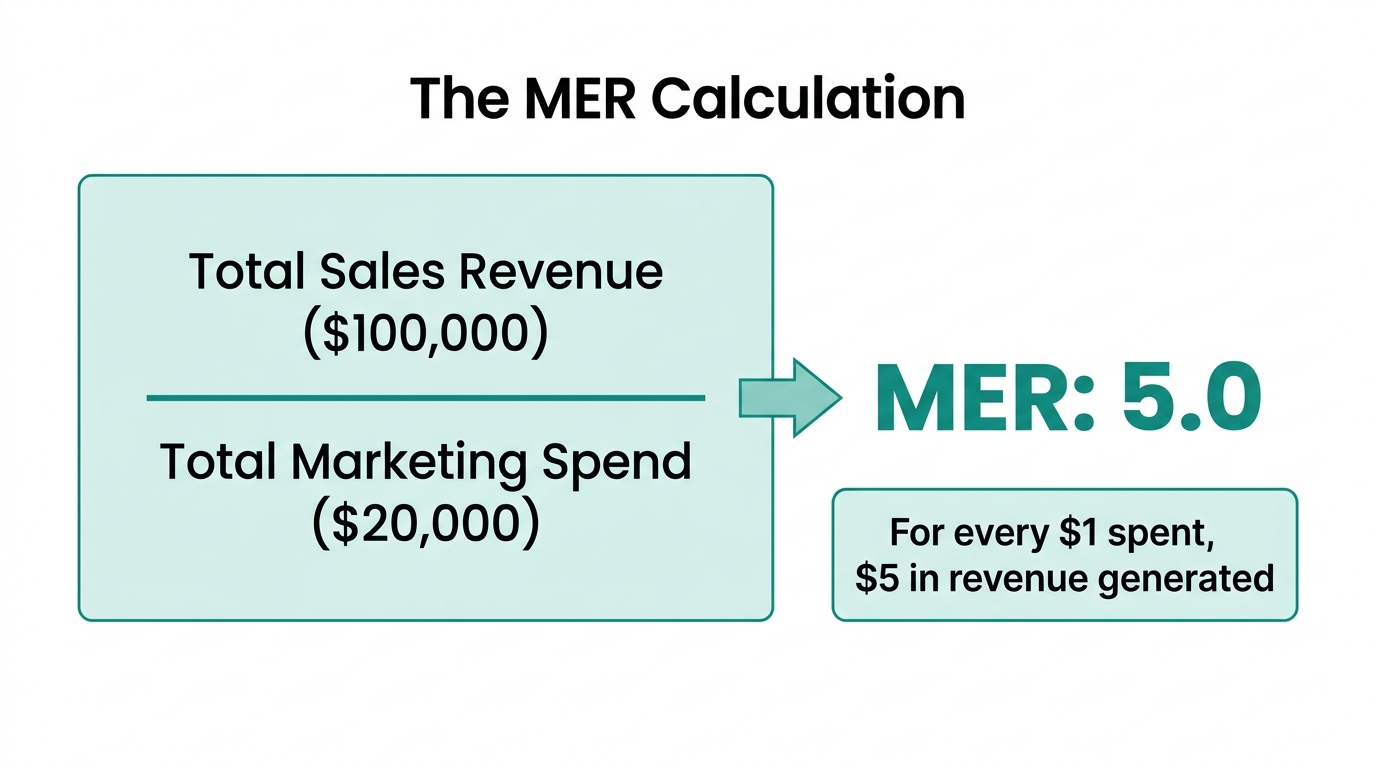
Calculating your blended ROAS calculation is mathematically simple, but the data collection is where most founders fail. The formula is:
For example, if your Shopify store generates $100,000 in total revenue (including organic, email, and social) and you spent $20,000 across Amazon Ads, Meta, and Google, your MER is 5.0. This means you are earning $5 for every $1 spent on ads.
What should your MER goal be?
Your target MER depends heavily on your Contribution Margin. If your product margins are thin (e.g., 30%), you need a much higher MER to remain profitable than a brand with 80% margins. Most healthy Shopify brands in 2026 aim for an MER between 3.0 and 5.0, depending on their growth stage. A brand in aggressive growth mode might accept an MER of 2.5, while a mature brand focused on dividends might push for a 7.0.
However, ecommerce marketing spend optimization isn't just about the ratio; it's about the context. If you increase spend and your MER stays flat while total revenue climbs, you are successfully scaling. If your MER drops significantly as you scale, you are reaching the point of diminishing returns.
Identifying 'Phantom' Conversions and Data Gaps
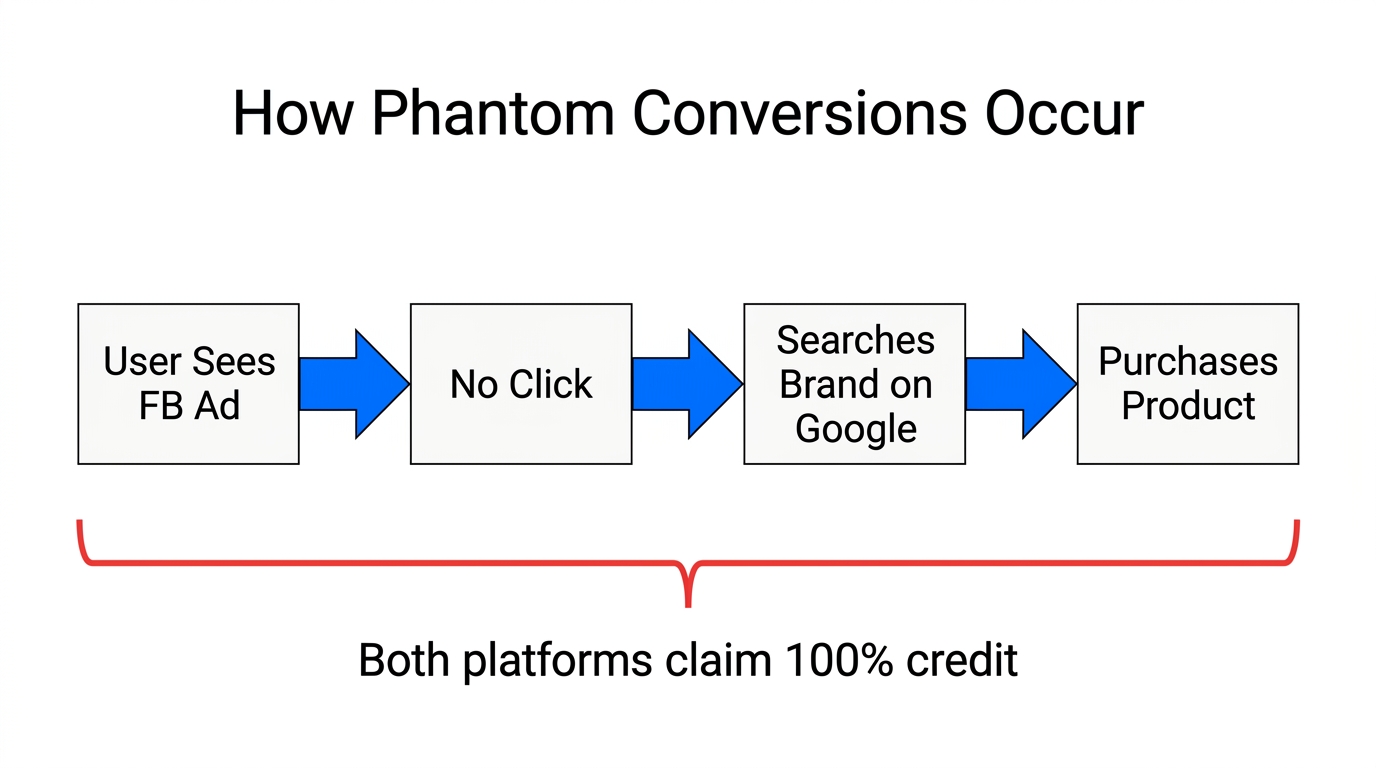
Why doesn't your MER match your combined ROAS? The answer lies in Phantom Conversions. These are sales that appear in your TikTok Ads or Meta dashboards but never actually happened—or at least, not in the way the platform claims. Common causes include:
- View-through Attribution: A customer saw your ad, didn't click, but bought something three days later after receiving an email. Meta takes credit, but the email drove the sale.
- Cross-Device Errors: A customer clicks on their phone but buys on their laptop. Platforms often struggle to link these, sometimes counting them twice or losing the link entirely.
- Bot Traffic: Sophisticated bots can trigger conversion events that look real in an ad manager but never result in a cleared payment in Stripe.
"If you add up the 'conversions' reported by Meta, Google, and TikTok, they often exceed the total number of orders in your Shopify admin. That gap is the 'Attribution Tax' you pay for relying on platform data."
To combat this, you must audit your ad spend against real Shopify bank deposits. This means ignoring the 'Purchases' column in your ad manager and looking at the 'Total Sales' in your Shopify Marketing Analytics. If the numbers are wildly off, your Shopify profit analytics are being distorted by phantom data.
The 2026 Audit Playbook: Spend vs. Bank Deposits
To get a clear picture of your ecommerce marketing spend optimization, follow this manual audit process once a month—or ask an AI agent to do it weekly.
Step 1: Export Total Net Revenue
Go to your Shopify Admin > Analytics > Reports. Look for the Total Sales or Net Sales report. Do not use 'Gross Sales' as it includes taxes and shipping which aren't part of your marketing efficiency.
Step 2: Aggregate Global Ad Spend
Collect the total spend from every single platform: Meta, Google, TikTok, and Amazon Seller Central. Ensure the date ranges match perfectly. This is where most errors occur, as different platforms use different time zones.
Step 3: Factor in the 'Hidden' Marketing Costs
True MER should include more than just digital ad spend. Consider adding your influencer fees, creative production costs, and software subscriptions (like Klaviyo or Gorgias) to get an 'Omni-MER.' This gives you a brutal look at how much it truly costs to acquire a customer in 2026.
Step 4: Compare with COGS
Finally, subtract your Cost of Goods Sold (COGS) from your total revenue to find your contribution margin. If your MER is 4.0 but your COGS is 60%, you are barely breaking even after shipping and overhead. This level of clarity is why Google Ads reports alone cannot run a successful brand.
Automating the Messy Back Office with Stormy AI
If the steps above sound like a weekly nightmare of CSV exports and VLOOKUPs, you're right. It is a "big pain and how messy it can get," as many founders realize when they try to build this manually. Missing data, inconsistent currencies, and different date ranges make manual MER tracking prone to errors.
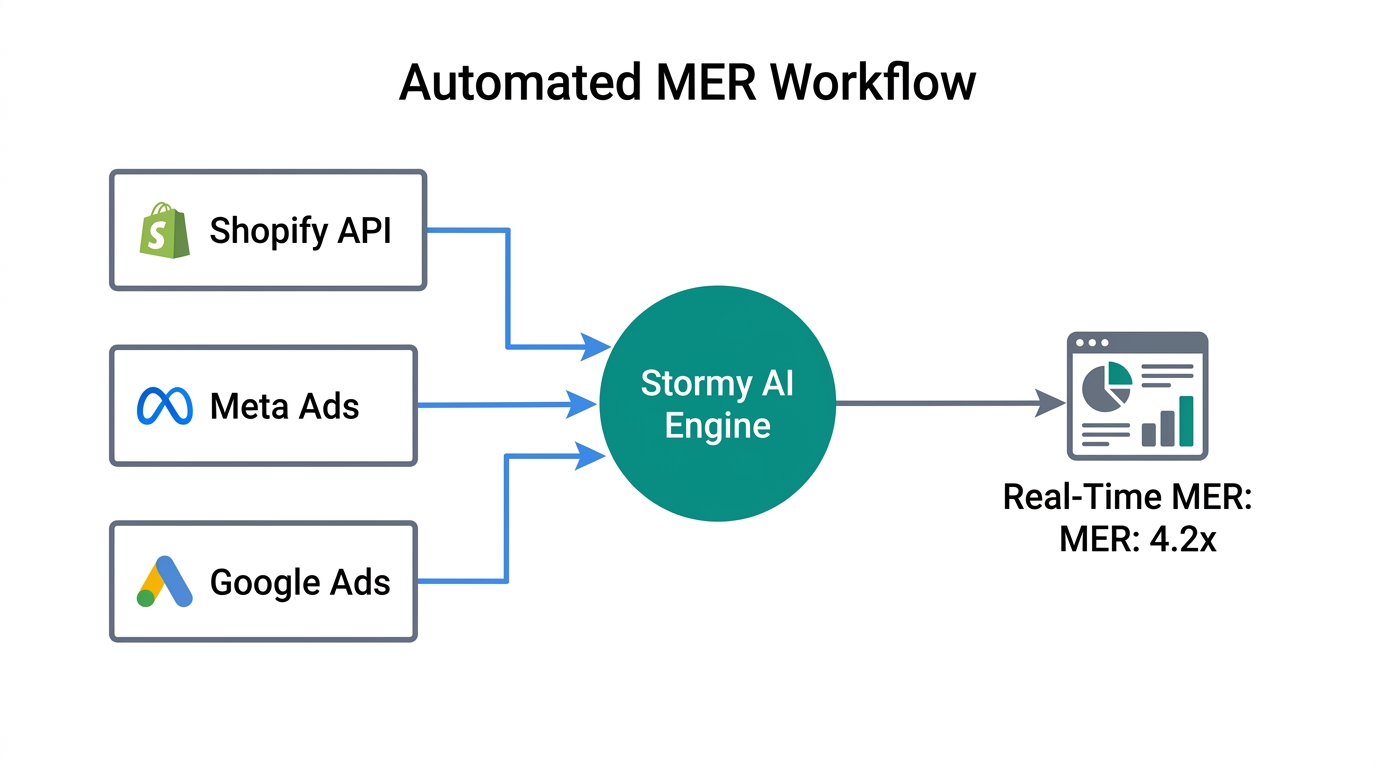
This is exactly why we built Stormy AI. Stormy isn't just another dashboard; it is an AI ecommerce employee that lives in your back office. You can ask Stormy to:
- Aggregate Spend Automatically: Stormy connects to your Google Ads, Meta, and TikTok accounts to pull daily spend data.
- Build Dynamic Spreadsheets: Instead of you manually copying data, Stormy AI builds a living workbook that combines Shopify revenue with real-time ad spend.
- Flag Efficiency Drops: You can set a rule: "Stormy, if our daily MER drops below 3.5, send me a Slack alert and highlight which platform's CPA spiked."
- Audit Performance: Stormy compares the conversions reported by Meta against your actual Shopify orders to identify which campaigns are driving 'phantom' sales.
"Stormy AI moves you from asking 'Which ad performed better?' to asking 'Is my overall marketing strategy profitable?' This shift changes every decision you make, from scaling budgets to hiring creators."
Conclusion: Moving from Tactics to Strategy
Shift your focus from specific ad performance to the overall efficiency of your marketing.In 2026, the brands that thrive are the ones that treat their marketing spend like a financial portfolio rather than a series of disconnected bets. Shopify marketing efficiency ratio is the ultimate benchmark for this portfolio. By moving away from the 'lying' ROAS metrics of individual platforms and focusing on your blended efficiency, you gain the clarity needed to scale with confidence.
Don't let platform attribution distract you from your real goal: net profit. Whether you use a tool like Analyzify to see these reports inside Shopify or hire an AI employee like Stormy AI to handle the data aggregation and alerting in the background, the transition to MER is no longer optional—it is a requirement for survival.
Ready to see your true numbers? Start by auditing your last 30 days of spend against your actual bank deposits. You might be surprised at what you find. For those ready to automate the boring parts of the back office, explore how Stormy AI can keep your spreadsheets updated and your margins protected while you focus on building your brand.