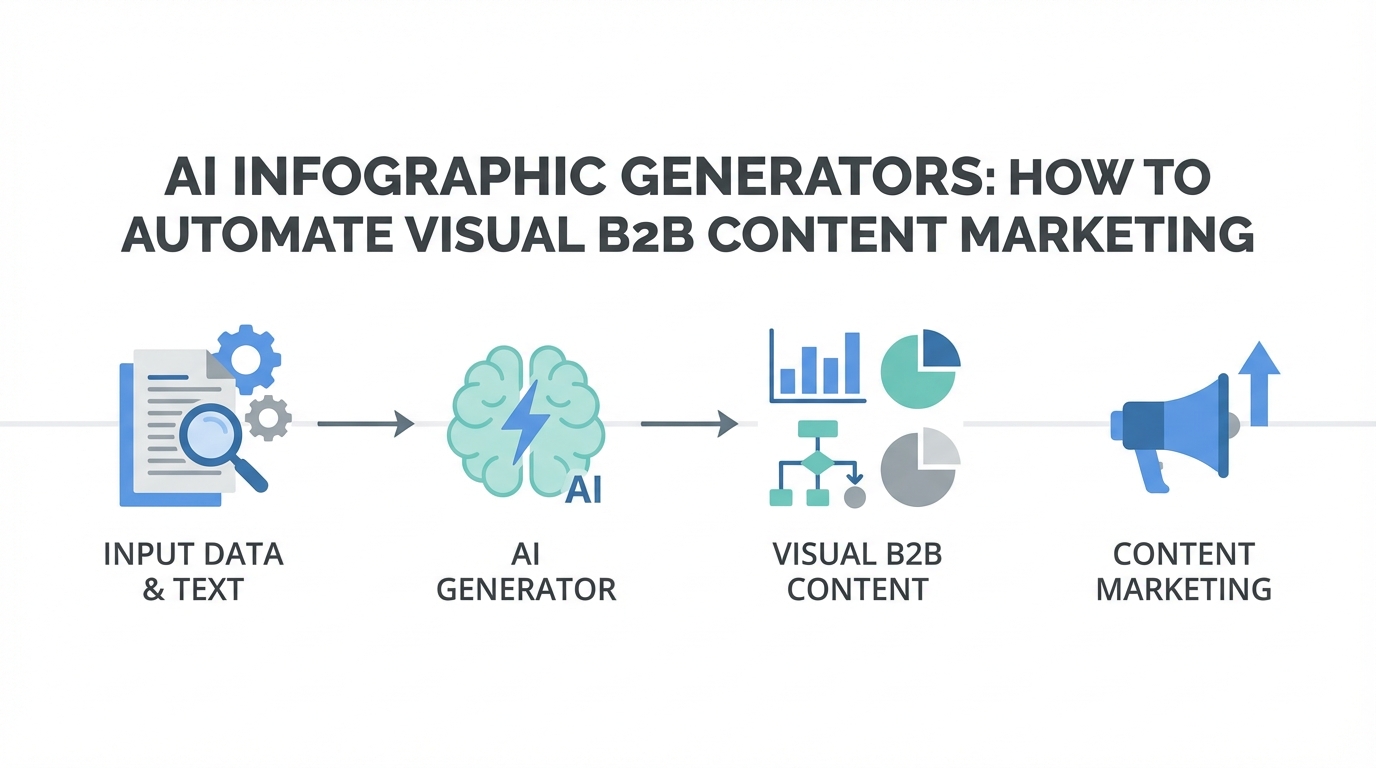
In the fast-paced world of digital growth, the ability to turn a wall of text into a visually compelling asset is no longer just a design perk—it is a competitive necessity. As B2B brands struggle to capture attention on platforms like LinkedIn and X (formerly Twitter), a new wave of AI infographic generator tools is emerging to bridge the gap between deep insights and viral distribution. The demand is massive: current search data shows over 9,000 monthly searches for an AI infographic generator, yet the market remains largely underserved by high-quality, productized solutions.
The SEO Arbitrage: Analyzing the 9,000+ Search Opportunity
Marketing is often a game of identifying high-intent search volume before the competition saturates the niche. Currently, visual content marketing is undergoing a massive shift. Entrepreneurs are discovering that exact match domains (EMDs) like AIinfographicgenerator.com can still be snatched up for pennies, despite the 9,000+ monthly searches for that specific phrase. This represents a classic SEO arbitrage opportunity: the search interest is skyrocketing, but the incumbent tools are still catching up to the AI revolution.
This trend mirrors what we’ve seen in other AI categories. For example, keywords like AI journaling (8,100 searches) and AI receptionists are exploding because they solve a clear point of friction. In the case of infographics, the friction is the high cost and slow turnaround time of traditional graphic design. By positioning a tool or service around these specific high-volume keywords, you can build a top-of-funnel organic engine that captures users exactly when they realize they need to automate their design workflow.
Transforming Unstructured Data: From Blog Posts to Viral Infographics
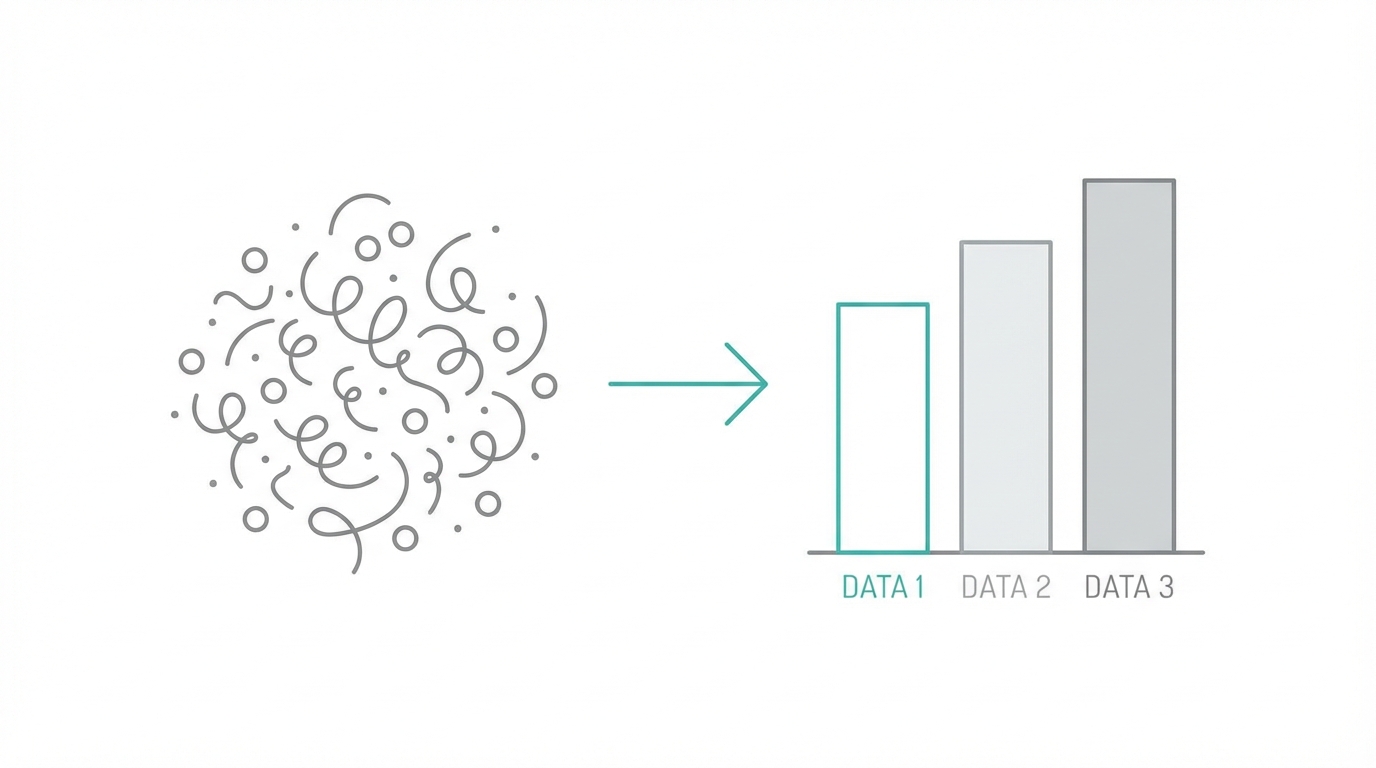
The true power of a modern AI infographic generator isn’t just in the "design"—it’s in the logic and structuring of information. Large Language Models (LLMs) are exceptionally good at taking unstructured data—like a 3,000-word blog post, a transcript from a podcast, or a technical whitepaper—and distilling it into a structured hierarchy. This is the first step in a professional B2B content strategy.
To execute this, you don't need to reinvent the wheel. You can feed your content into ChatGPT or another LLM and use a specific prompt framework: "Identify the five key takeaways from this text, write five supporting paragraphs, and suggest five relevant icons or images for a visual layout." Once the data is structured, it can be passed to design APIs like Canva’s Developers platform to generate a polished final product. This turns a five-day design process into a 30-second automated workflow.
B2B Demand: Why Brands Pay for Visual Engagement
Why is there such a massive hunger for an infographic service? In the B2B world, budgets are larger, but the competition for executive attention is fierce. Data from visual marketing studies suggests that a post featuring a high-quality infographic can generate 10x the engagement compared to text alone. For a B2B brand, more engagement translates directly into more eyeballs, more leads, and ultimately more sales. This is why agencies like Just3 have built multi-million dollar businesses focused purely on infographics.
Automated graphic design tools allow brands to maintain a consistent lifestyle-based cadence of posting. Instead of one infographic per quarter, a brand can now publish three per week. This volume is critical for staying top-of-mind on social algorithms. When combined with other automation tools like Vapi for reception or Google Ads for traffic, an AI-driven visual strategy becomes the backbone of a high-growth marketing department.
Productization: Moving to a Cadence-Based Subscription Model
If you are looking to build a business in this space, the goal should be recurring revenue. Many AI tools fail because they offer "one-and-done" solutions—like a logo generator. Most companies only need one logo. However, a B2B content strategy requires a constant stream of visuals. This is where you move from a tool to a subscription model.
The most successful SaaS products are those that integrate into a user’s daily or weekly routine. Just as Shopify handles the daily operations of an e-commerce store, your infographic tool should handle the weekly visual output for a marketing team. By focusing on automated graphic design that happens on a set cadence, you increase customer retention and lifetime value (LTV). You are no longer selling a graphic; you are selling a distribution flywheel.
Growth Hacks: Using EMDs and Backlink Strategies
Building a great product is only half the battle; distribution is the other. To dominate the "AI infographic generator" niche, you should employ a distribution-first mindset. Start by securing an Exact Match Domain (EMD) to gain an immediate edge in search rankings. From there, the strategy is simple but effective: backlink aggressively. Even 10 high-quality links pointed at a specific keyword-rich domain can be enough to rank on the first page of Google for emerging AI terms.
Beyond SEO, consider the creator-led growth model. You can reach out to influencers on YouTube or TikTok who specialize in "aesthetic" content or productivity. Offer them an affiliate commission to demo your tool. In many cases, it takes three exposures to a product before a user makes a purchasing decision. By having multiple creators show how they use your AI tool to simplify their workflow, you build the necessary trust to convert high-intent traffic.
Expanding the Flywheel: UGC and Visual Synergy
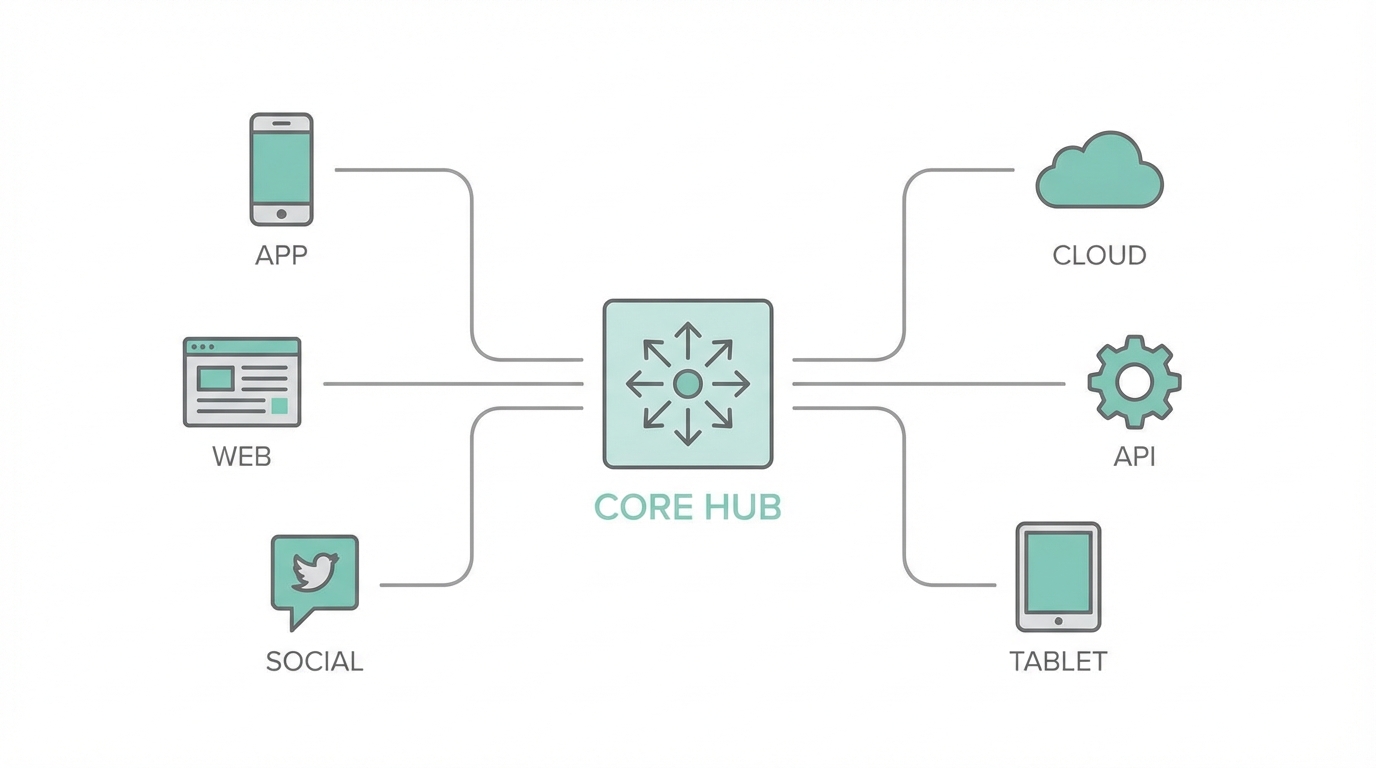
Visual content marketing doesn’t stop at static graphics. To truly scale, brands are now combining automated infographics with AI-generated UGC (User-Generated Content). Tools like HeyGen and Argil allow you to create AI talking-head avatars that can present the data found in your infographics. This creates a multi-channel experience: a structured infographic for LinkedIn and a corresponding video for TikTok Shop or Reels.
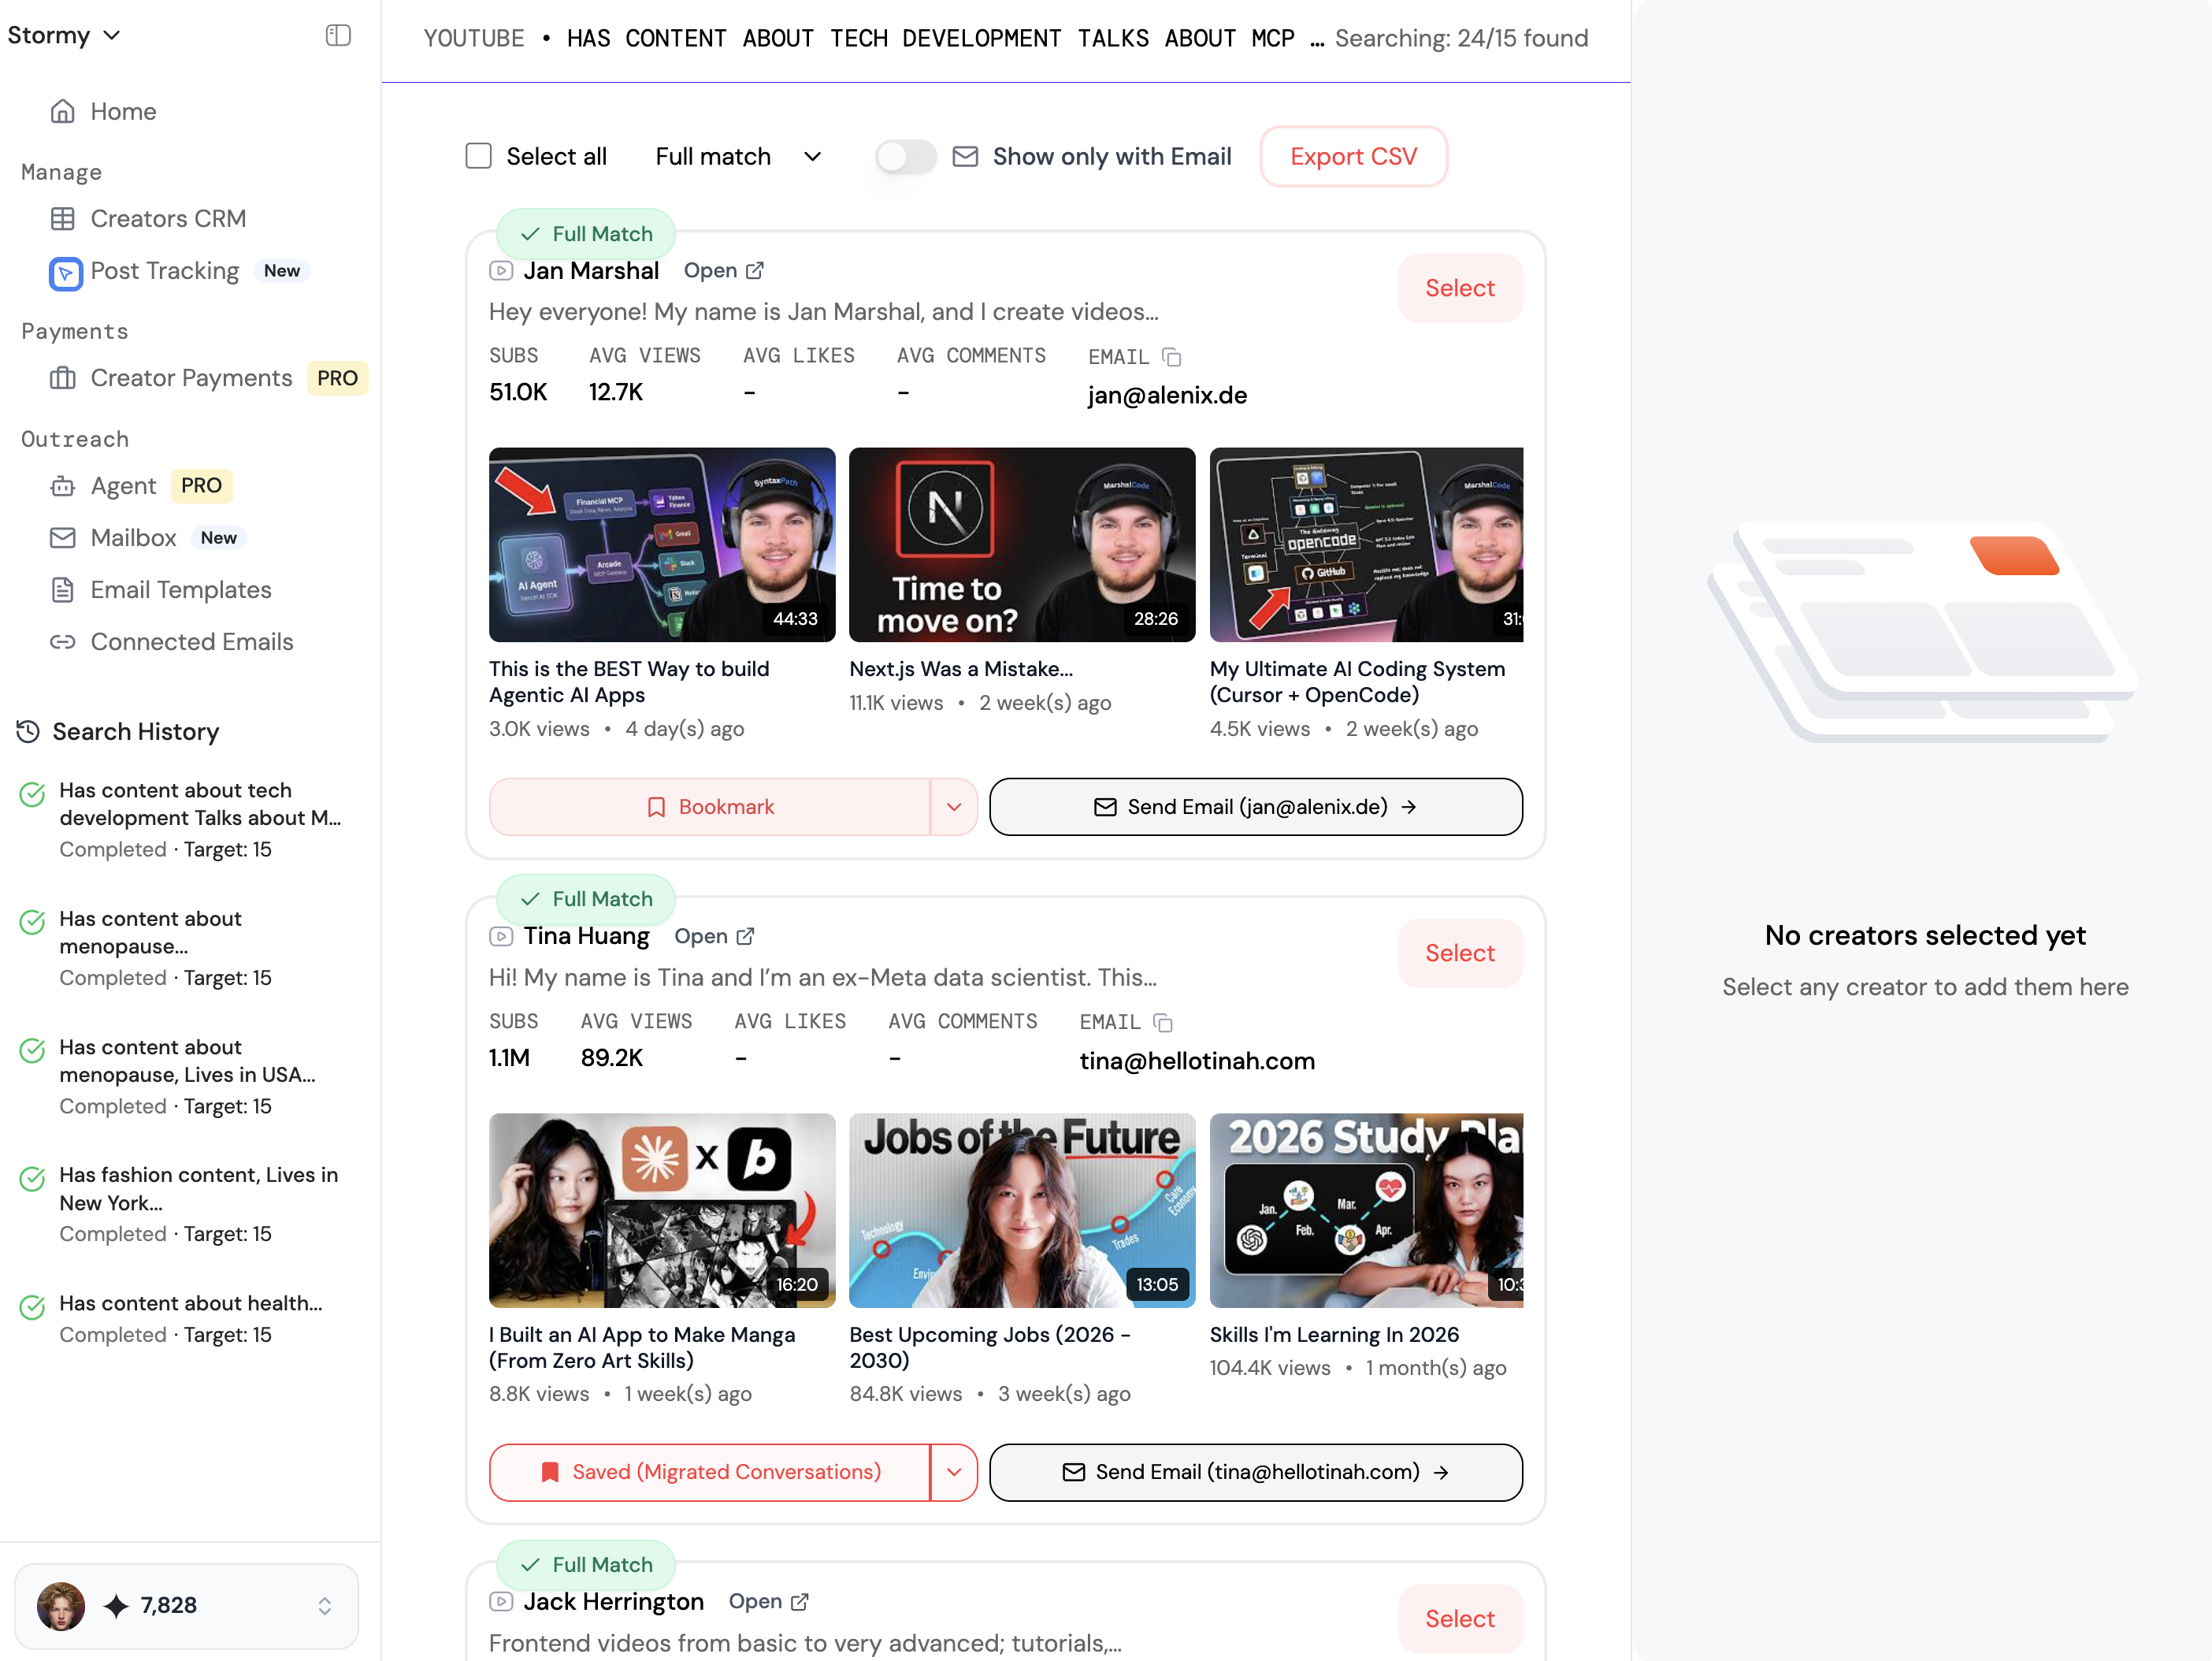
For brands that want to take this a step further, tools like Stormy AI can help source and manage real UGC creators at scale. While AI avatars are great for rapid testing, human-led UGC provides a level of authenticity that can drive higher conversion rates in app install campaigns and mobile marketing. By using Stormy to find creators who fit your niche, you can provide them with your AI-generated infographics as "source material" for their videos, ensuring your messaging remains data-driven and visually consistent across all platforms.
The Future: Building for the Next Wave
We are currently in a unique window of AI arbitrage. The technology is advanced enough to provide real value, but the market hasn't yet been consolidated by massive incumbents. Whether you are building an AI infographic generator as a SaaS product or using it to fuel your own B2B content strategy, the key is execution. Focus on the daily habits of your users, prioritize distribution via SEO and creator partnerships, and always look for ways to turn unstructured data into structured visual gold.
As you scale, remember that tools are only as good as the systems they support. Combine your automated design with robust CRM tracking and post-analytics to see which visuals are actually moving the needle. Platforms like Stormy AI provide the infrastructure to track these campaign performances, ensuring that your automated graphic design efforts result in measurable business growth.
Conclusion: Your Action Plan for Automated Visuals
To capitalize on the surge in AI-driven visual content, follow this three-step playbook: First, identify a high-volume, low-competition keyword like "AI infographic generator" and secure your digital real estate. Second, build a workflow that uses LLMs to structure your existing long-form content into visual-ready outlines. Third, distribute that content across high-engagement channels like LinkedIn and Meta Ads Manager, using a mix of automated tools and creator partnerships to maintain a consistent cadence. The future of B2B marketing is visual, automated, and data-driven—start building your flywheel today.